Contents
About m365maps.com
m365maps.com is my personal collection of Microsoft 365 Licensing Diagrams and reference material, regularly updated as product names, feature inclusions, and license types change.
Each diagram illustrates the key features and overlap between different license types. The diagrams load in your browser and you can click on the feature tiles to navigate to official online documentation. There are many more features to explore, described within this user guide.
You will also find the PDF, PNG, and SVG versions of the diagrams on the Downloads page of the site. PDF, PNG, and SVG versions are also downloadable from their individual diagram view pages.
I work for Microsoft in Australia and I create these diagrams in my free time, so it goes without saying that this is not official Microsoft material. The site contains visual representations of the product licensing that I've derived from Microsoft's online and partner-facing resources. This site does not represent Microsoft, and no warranty is given or implied. You should always work with your Microsoft account team or authorised reseller before making a purchasing decision.
I try to carefully balanced the level of detail to ensure all the important features and license types are accounted for, but not every feature is present in these diagrams. There are just too many to include! So my offer to you is that if you see something missing and believe it should be there please contact me and I will do my best to build it in to a later release.
All feedback is greatly appreciated!
Feel free to connect with me on LinkedIn if you'd like to follow update announcements or discuss the project or Microsoft 365 licensing with me.
The m365maps.com web site is an enjoyable side-project as it allows me to have fun coding, which I no longer do as my day job. I decided I would maintain the site with very simple HTML, CSS, and JavaScript. Everything is hand crafted without frameworks, libraries, or external dependencies of any kind.
Cheers,
– Aaron.
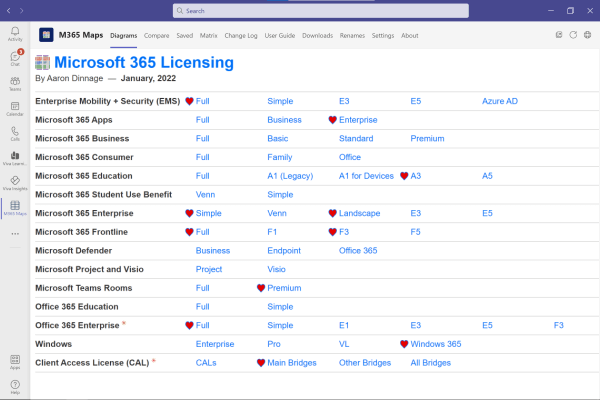
Home page
The home page is the first page you reach when you navigate to the site.
When the site loads for the first time, and after each update, it reaches out and caches all the core web site components. This happens as a background task in your browser so you don't have to wait. Within a matter of seconds you can go offline and still have access to every core page and every diagram you have visited. It only does this once until the next time either the web site files or the diagrams are updated.
This all means that day-to-day there is very little traffic generated by the site and it remains fast to access and navigate. The offline cache uses about 2 megabytes of storage. So the site is not only fast, but also friendly to low bandwidth devices and networks.
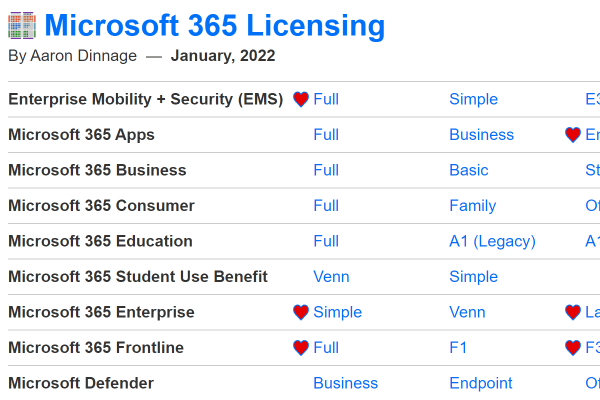
Diagram date
The month and year of the last update is posted directly under the web site name heading. In the example screenshot above you can see the site was last updated in January, 2022.
Groups
All diagrams are grouped by license type. For example, all stand-alone EMS licenses are represented in the diagrams associated with the group "Enterprise Mobility + Security (EMS)" shown in the screenshot above.
Diagram links
In the screenshot you can see the diagrams listed to the right of the group header. Depending on your browser, device, and screen size this may be all in a line horizontally, clustered, or listed under the group name. Each diagram link will take you to the view diagram page.
Flags
You can flag your most commonly accessed or preferred diagrams to make them visually stand out and be easier to find in the list. This icon means the diagram is flagged. To flag a diagram you must open the diagram link and then click the flag button on the diagram view page. Flags are stored and persist between sessions.
New content indicator
Any diagram groups that have been added, or added to, in the most recent update will have the following red asterisk indicator next to them:. At the following update the new content indicator will be removed.
Draft diagrams
From time to time I will publish draft diagrams that are not yet ready for release but are included to gather feedback or test a new feature. Draft diagrams will include the word "DRAFT" in the diagram list and have the word "DRAFT" watermarked on the diagram (including SVG, PNG, and PDF downloads).
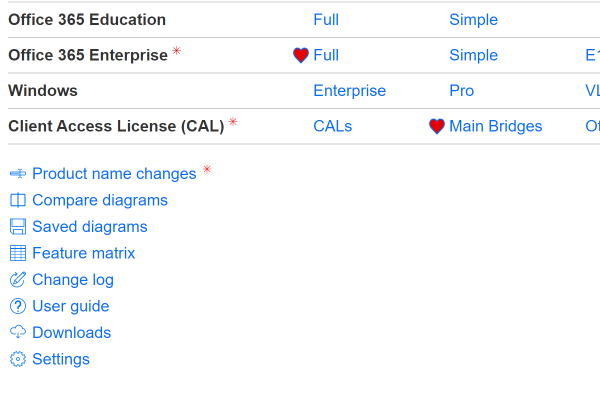
Product name changes
Navigates to the product name changes page, which lists recent Microsoft product name changes with links to announcements and product details.
Compare diagrams
Navigates to the compare diagrams page, where you can create a sliding side-by-side comparison between two site or saved diagrams.
Saved diagrams
Navigates to the saved diagrams list. When viewing a diagram it is possible to make highlights and add drawings and text annotations, which can be saved and displayed at a later time. More information on Edit modes are available in this guide.
Feature matrix
Navigates to the feature matrix page, where you can view a table of feature inclusions across a range of license types with the ability to filter and search.
Change log
Navigates to the change log which details the history of changes with each site update.
User guide
Navigates to this user guide.
Downloads
Navigates to a page of download links for every diagram, in PDF, PNG, and SVG format. The downloads page also includes a PowerPoint slide deck, an Excel spreadsheet of the feature matrix, and the M365 Maps for Teams app.
Settings
Navigates to the settings page for the web site where various configurations can be made.
View diagram - Page features
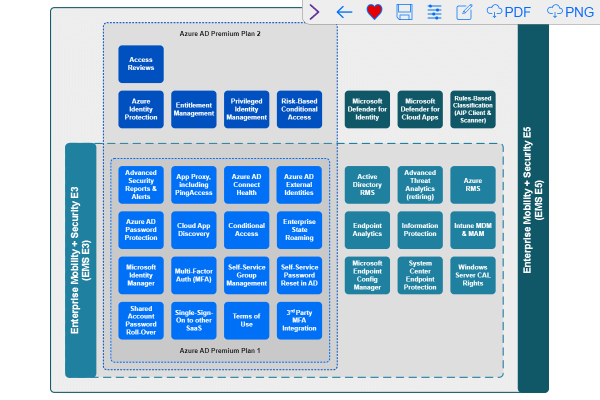
Feature links
The feature tiles within each diagram link to further online documentation. All links open in a new browser tab so you won't lose your place with the diagram you are viewing.
Zoom
The mouse scroll wheel is used to zoom in and out when viewing a diagram. This operates in much the same way as a street map website would. When you zoom with the mouse wheel the page will be scrolled to keep the point under the mouse cursor from being zoomed out of view.
Zooming in and out can also be achieved with the + and - keys, and = resets the zoom level.
Pinch to zoom remains available on touch screen and touch pad equipped devices.
Clicking the zoom wheel button / middle mouse button on the diagram will reset the zoom level to the default. The default zoom level is also applied when you first open the view diagram page. The default zoom level can be configured on the Settings page.
Drag to scroll
You can click and drag the diagram using the left mouse button, or with touch drag on touch screen devices, to move around the diagram.
Clicking and dragging will not follow a link within a diagram. Only clicking without drag movement will follow a link in the diagram.
View diagram - Menu features
The collapsible menu in the upper-right corner of the view diagram page gives you quick access to a number of navigation options and other features depending on your device and the viewing mode you are in.
The standard menu arrangement, as pictured above, appears when you first navigate to a diagram. It is possible to set the menu to be automatically collapsed or open by default, this is detailed in the Settings portion of this guide.
Depending on your device and viewing mode the following actions may be available within the menu:
View diagram - Edit modes
There are six different edit modes available to help you customise visualisations to communicate licensing details and opportunities to your colleagues or customers, or just for your own reference. Clicking the edit icon on the main menu will expand or collapse the edit modes menu shown above.
Tip: Whilst in the Highlight, Draw, Text, or Image edit mode you can Left-click and Drag to enable the mode-specific eraser (). Dragging the eraser over an item of that mode will erase that item. For example, whilst in Highlight mode if you Left-click and Drag you will erase any highlight you pass your cursor over.
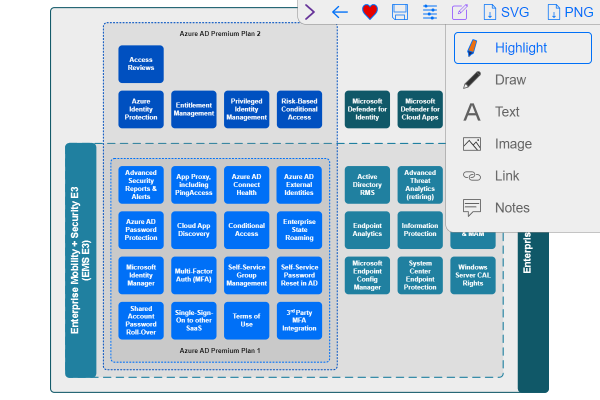
Your edits can be stored by clicking the save icon () and then providing a name for your diagram. Diagrams you've saved are accessible from the Saved diagrams and Compare diagrams pages.
View diagram - Image controls
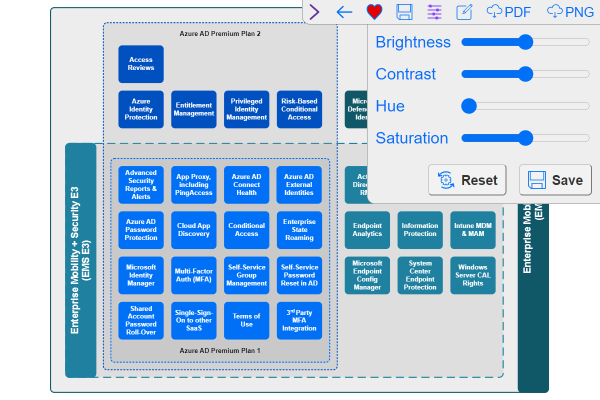
The image controls menu allows you to control the brightness, contrast, hue, and saturation of the diagram you are viewing.
The Reset button () reverts all image controls to their default values.
The Save button () commits the current image control levels to memory and uses them on all diagrams from that point on.
Tip: If you've saved a set of image controls and would no longer like them to apply, click Reset and then Save.
Compare diagrams
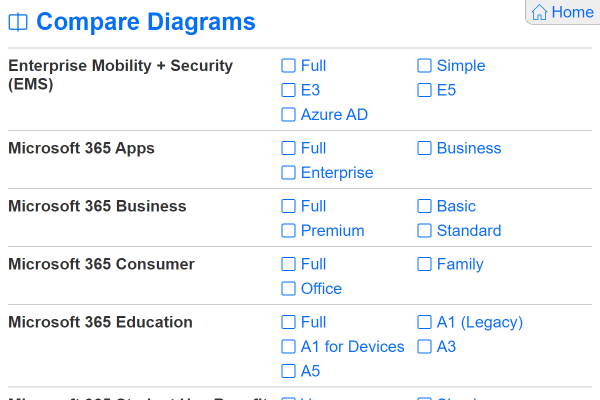
The Compare diagrams page lists all the included diagrams and any saved diagrams, allowing you to compare a combination of two diagrams side-by-side. Simply select the two diagrams for comparison and then click the Compare button at the bottom of the page.
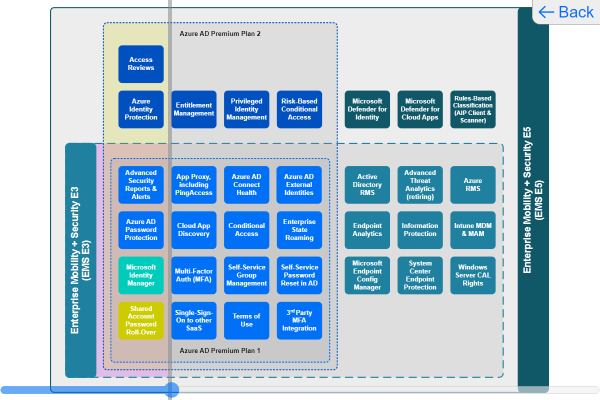
After clicking compare you will be taken to a modified view page with a slider at the bottom to drag between the two diagrams you selected. Zooming and Click-to-Drag moving features still function, but no edit menu features are available from the comparison page.
Feature matrix
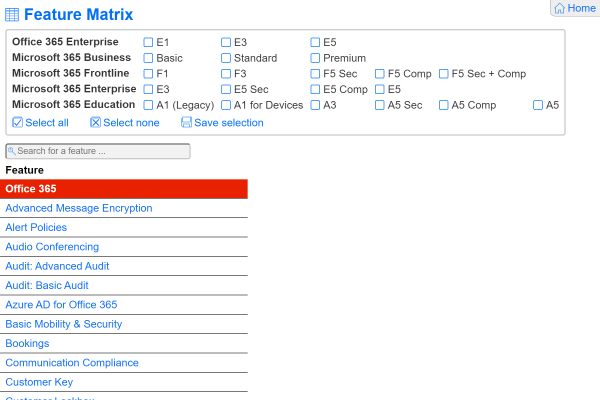
The Feature matrix page lists all the features from the license diagrams in a table layout, allowing you to compare a combination of license types side-by-side.
Select license types to compare with the checkboxes at the top of the page and filter the feature list by typing into the search box.
When selecting license types using the checkboxes the feature list automatically filters to show only the features relevant to your selection.
When searching for features using the search box, all features that match your text will be shown even if they are not part of any of your selected license types.
Tip: The page address is updated with each change of license type checkbox selection, allowing you to bookmark the selection in your browser.
Tip: An Excel version of the Feature Matrix is available on the Downloads page.
Saved diagrams
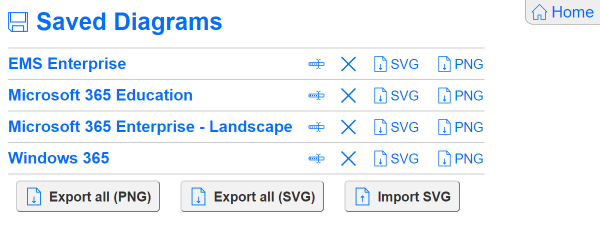
The Saved diagrams page provides a list of all the diagrams that you have saved from the View diagram page, sorted in the order you saved them.
Clicking on the saved diagram name will take you to the View diagram page. From there you can review your edits, make new edits (including removing existing highlights), and save over or create a new copy of the diagram.
A number of actions are available against each saved diagram from this page as follows:
Tip: PDF exporting is not available on m365maps.com but many devices now support "Print to PDF". The menu and offline/online indicators will be hidden in print outs, printing only the diagram.
There are three buttons at the bottom of the saved diagrams page:
- Export all (PNG) - Downloads all the saved diagrams as PNG files.
- Export all (SVG) - Downloads all the saved diagrams as SVG files.
- Import SVG - Imports an SVG file from your device and adds it to the saved diagrams list so that you can display and edit it within m365maps.com.
Tip: Saved diagrams are stored by your browser and can be easily lost, so it's a good idea to export important diagrams every once in a while. That way you can import them back in if you need to.
This page has a Home page link in the top-right corner.
The menu actions available when viewing a saved diagram are slightly reduced from the normal view diagram experience. Diagram flagging is not available for saved diagrams.
Settings
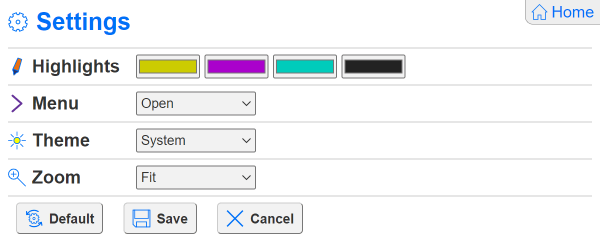
The Settings page allows you to customise some of the web site features to your preference.
There are three buttons at the bottom of the settings page:
- Default - Resets all settings to the site defaults, but doesn't commit the settings reset until you click Save.
- Save - Saves your changes and returns to the Home page.
- Cancel - Cancels any changes you may have made and returns to the Home page.
This page has a Home page link in the top-right corner.
M365 Maps for Teams
The Microsoft Teams app brings m365maps.com directly into your Teams client as a personal tab app. All the site functions are available directly inside Teams, with some user interface streamlining to make the experience more suited to the Teams interface.
M365 Maps for Teams does not connect with the Teams SDK, so there is no exchange of personal information or user tracking of any kind. I've deliberately kept the app simple to make it easier for organisations to choose to allow the app to run in their environment.
Users can self-install the app using the instructions below, or have an organisation administrator load the app for all users within the Teams tenant to access. Microsoft publishes generic administrator installation instructions.
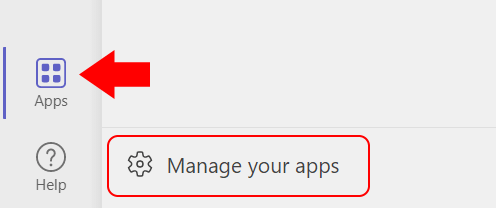
To add the M365 Maps for Teams app to your own Teams environment, first navigate to the Apps side tab and select "Manage your apps" from the bottom of the store panel, as pictured above.
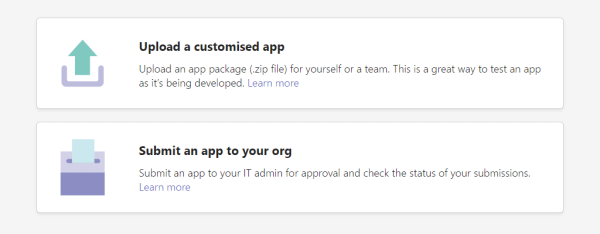
You can then choose to either add the app to your own environment, or submit it for inclusion in your organizations app list. For these instructions we will focus on uploading for your own personal use, to do so select "Upload a customised app", as pictured above.
After selecting the M365 Maps for Teams.zip you will be presented with further information on the app and be able to add it to Teams.
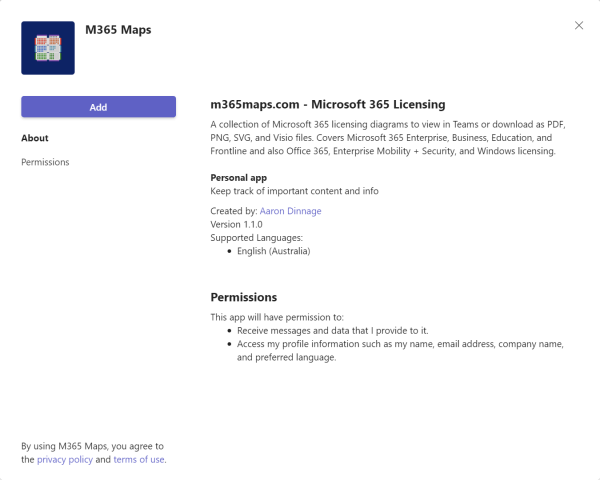
The Add App process will provide app and publisher details, as well as required app permissions. Please note: Whilst Teams will advise that the app has access to receive messages and data you provide it, M365 Maps will not ask for data or interact with messages. Also, the permissions set will advise that M365 Maps will have access to your profile information, M365 Maps will not access this information as the app does not utilise the Teams SDK or APIs. This can all be independently verified by examining the open source code inside the zip file.
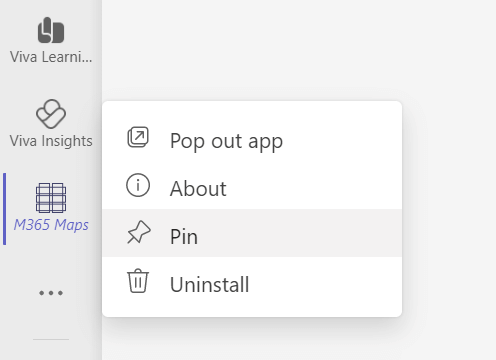
After uploading the M365 Maps for Teams app you you will be taken to the app. If you want to keep quick access to M365 Maps you can pin the app by opening the left-click context menu and selecting "Pin".
Browser compatibility
m365maps.com targets the same mainstream web browsers that Microsoft 365 supports: Edge, Firefox, Safari, and Chrome.
Internet Explorer, out of date builds of mainstream browsers, and any other niche browsers are not targeted for compatibility or tested. Your experience may vary.
If you have a particular device or browser scenario you'd like me to try to support then please contact me to discuss.
Known issues
- Apple iOS (iPhone / iPad)
You can only install a Progressive Web App ("Add to Home Screen") from the Apple Safari browser and not from a third party browser like Edge or Chrome.
Multiple file downloads ("Export all ...") are disabled on iOS for now.
Edge on iOS has the Export SVG and Export PNG actions removed on the View diagram and Saved diagrams pages. If you need this feature please use Safari for now.
- M365 Maps for Teams
The M365 Maps for Teams app follows the operating system theme when in the Teams desktop app and the browser theme when in the web browser.
Contact
Aaron Dinnage
If you'd like to provide feedback, report an error / omission, ask a question, or discuss an idea, then please use LinkedIn to connect. Licensing can be complicated which often means a conversation is needed to process feedback effectively.
Privacy policy
m365maps.com does not request, collect, store, process, or manage any personal information.
Use of third party services linked from m365maps.com is subject to the privacy policy and terms of use of those services.
m365maps.com is an Azure Static Web App.
Terms of use
Your use of m365maps.com depends on your acceptance of the following terms:
- m365maps.com is for informational purposes only
- m365maps.com does not guarantee accuracy
- You accept the m365maps.com privacy policy
- Microsoft is the only authoritative source of all Microsoft licensing terms and conditions
- You must validate all licensing decisions with Microsoft or a Microsoft licensing partner
References
The information contained within the diagrams on this site is sourced from a variety of references. If you'd like to see where this information comes from I've listed those sources below. Whilst a lot of the modern licensing resources are very good at a high level, it's often the case that some of the finer detail is in the deeper, longer form documentation. I try to capture some of that detail in my diagrams when I think it's particularly relevant.
Public
This material is publicly accessible on the internet without the need to sign in.
- Product Licensing Terms
Allows you to find product licensing terms by program and product family for Software and Online Services. Knowledge of Microsoft licensing programs is required to navigate the complexity, but answers to questions around feature inclusions can often be found here. These links I've found particularly useful:
- Service Descriptions
This is a great collection of feature-level detail that describes what's available and what the services can do. These links in particular are regular go-to resources for me.
- Licensing Guides
These licensing guides can be useful in answering more complex questions around different usage rights and scenarios.
- Power Platform
- Product Use Terms search
Useful for finding product use terms for packaged software (i.e. Office consumer).